BI System Quick Start
Please contact BI system admin to get access to BI system. And make sure the table you want to visualization already exists.
Visualization table
- Please enter the BI system, click add in the upper right corner and select Chart
- Select the table you want to visualize and select the visualization type. If the form is not found, please contact the BI system administrator to add a new table for you.
- Due to the variety of chart types, there is no detailed description here. If you want to view examples and usage of various charts, please click dashboard and view by yourself in.
- After adding the chart, you can select save in the upper left corner and save it to a dashboard.
Visualization Attribute
According to different table types, the attributes are also different. Here, take the most commonly used Line Chart as an example to briefly introduce how to modify table properties.
TIME COLUMN
The time column is very important. It can control the time of the horizontal axis of the BI system. Each table must have a time column.
TIME GRAIN
The time granularity for the visualization. This applies a date transformation to alter your time column and defines a new time granularity. The options here are defined on a per database engine basis in the Superset source code. Assuming that there is a indicator named as BUG NUMBER,If you want to change the calculation period from one week to one month, you can modify the TIME GRAIN
TIME RANGE
The time granularity for the visualization. This applies a date transformation to alter your time column and defines a new time granularity. The options here are defined on a per database engine basis in the Superset source code. If this property is not set correctly, the chart may not be displayed.
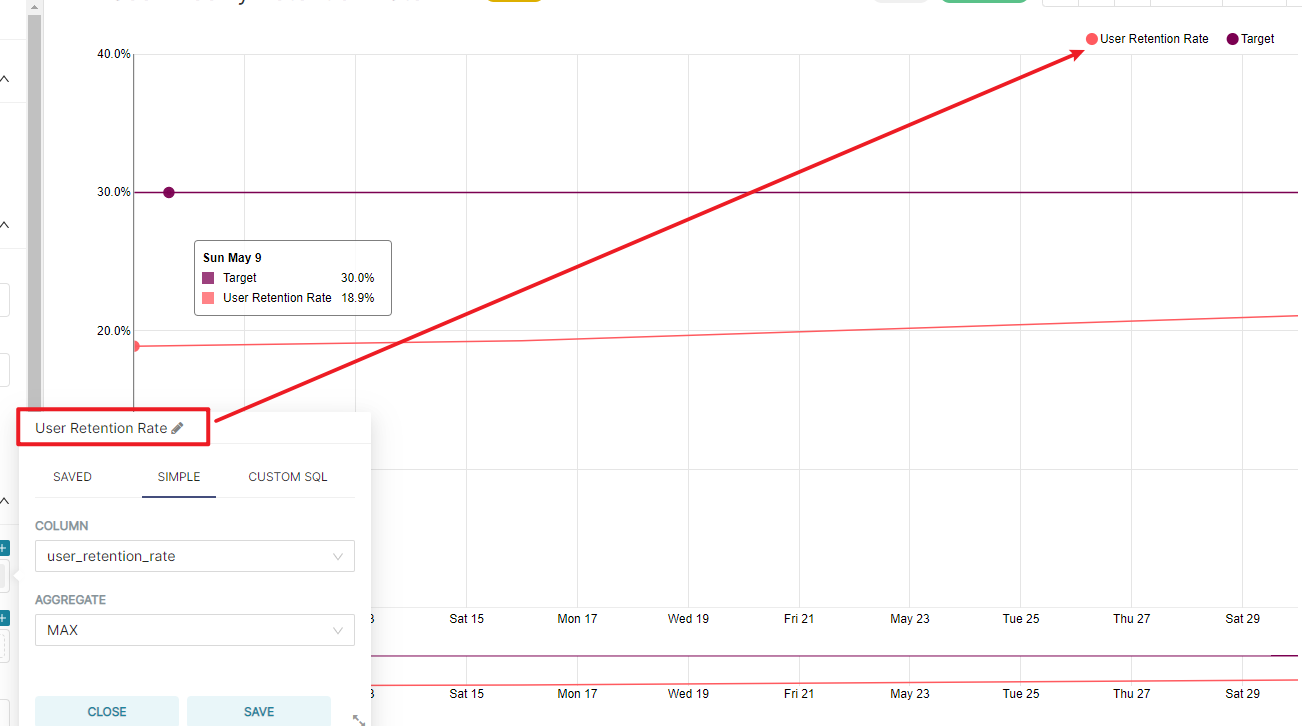
METRICS
This property is very important and directly controls the calculation results of the chart. Click a specific item to change the name, which will be displayed in the legend of the chart. It is not recommended to make any changes except renaming.
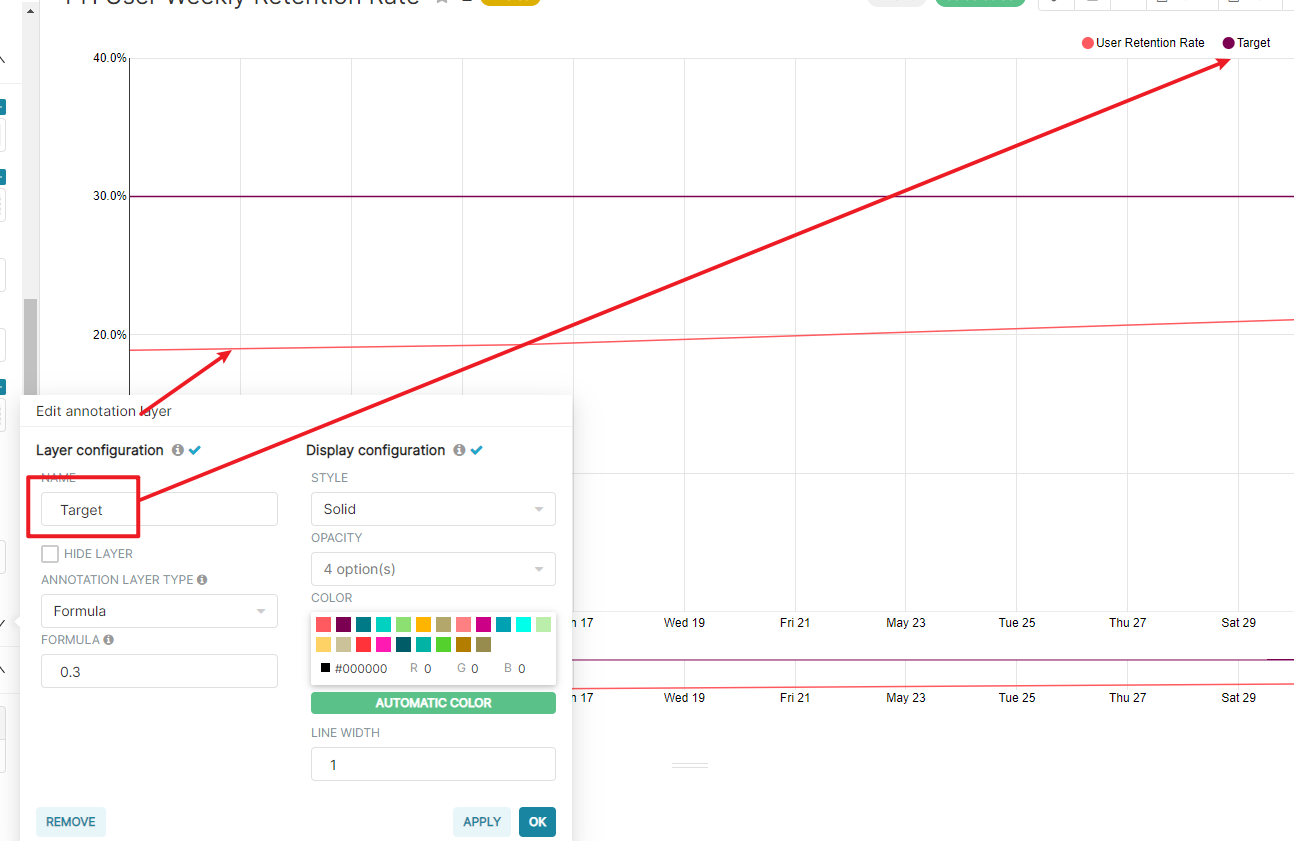
Annotations and Layers
This property can be used to add new horizontal lines. Edit this property to add a new Target.
Reference Table
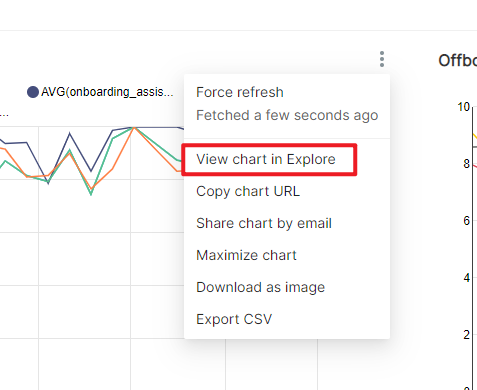
The essence of reference is actually iframe syntax. At present, it only supports the reference of charts in handbooks. The specific steps are:
Open BI System, and go to the corresponding dashboard to find the chart you want to reference and click "View chart in Explore"
Click the reference button on the top right and select copy
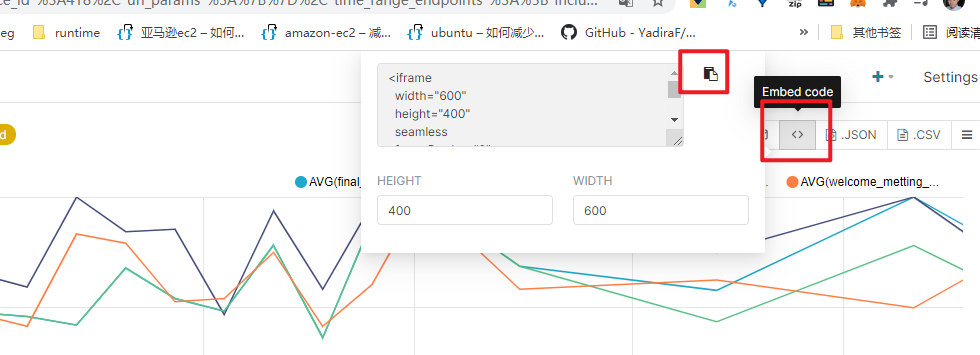
Open the document to be inserted, insert this string into the corresponding position, and then click other areas. If your editor supports iframe, the chart will be displayed. If you think the blank area in the chart is too large, you can manually increase the height value in the URL field
Q&A
Why can't I find the option of "View chart in Explore"?
A:Please set the dashboard to publish status in the settings of dashboard.
Why can't chart see the results?
A:Please note that all option settings in the chart, especially the date in time range, must have data